Most DSO CEOs can tell you which locations are underperforming. Few can tell you exactly why, or by how much, in a way that points to a fix. The gap between your best location and your median exists in your data already. The problem is that the data has never been organized in a way anyone can act on.
PE-backed DSO growth follows a predictable arc. You roll up locations, standardize back-office operations, and hit early targets through acquisition. Then the board asks what organic growth looks like, and the answer gets complicated. Aggregate revenue reports tell you what already happened. They don't show you which offices are underperforming on case acceptance, where hygiene capture is falling short, or how much recoverable production is sitting in your existing patient base unbilled. By the time those issues surface in reporting, the revenue gap is already built in.
That's the problem DSO Analytics was built to solve.
What you can't fix without seeing
Clinical variability is the structural reason same-store production stagnates. One practice captures SRP consistently; another with a nearly identical patient mix doesn't. Treatment plan presentations convert at 60% in one office and 35% in another, and the difference rarely comes down to clinical skill. These gaps don't surface in any report that rolls up to revenue. They live between locations, invisible until they've already cost you.
DSO Analytics maps clinical performance from the enterprise level down to the individual provider. Case acceptance rates by location and clinician, hygiene capture trends across the portfolio, a clear read on which offices are outperforming and what's driving it. The platform also tracks diagnostic utilization and provider adoption, so your COO has the data to intervene at a specific site before a dip becomes a trend. When you know what your best locations are doing differently, replicating it becomes a management decision rather than a guessing game.
For a CEO managing investor expectations, that visibility changes the conversation with the board. Same-store growth stops being a planning assumption and becomes something you can show data on.
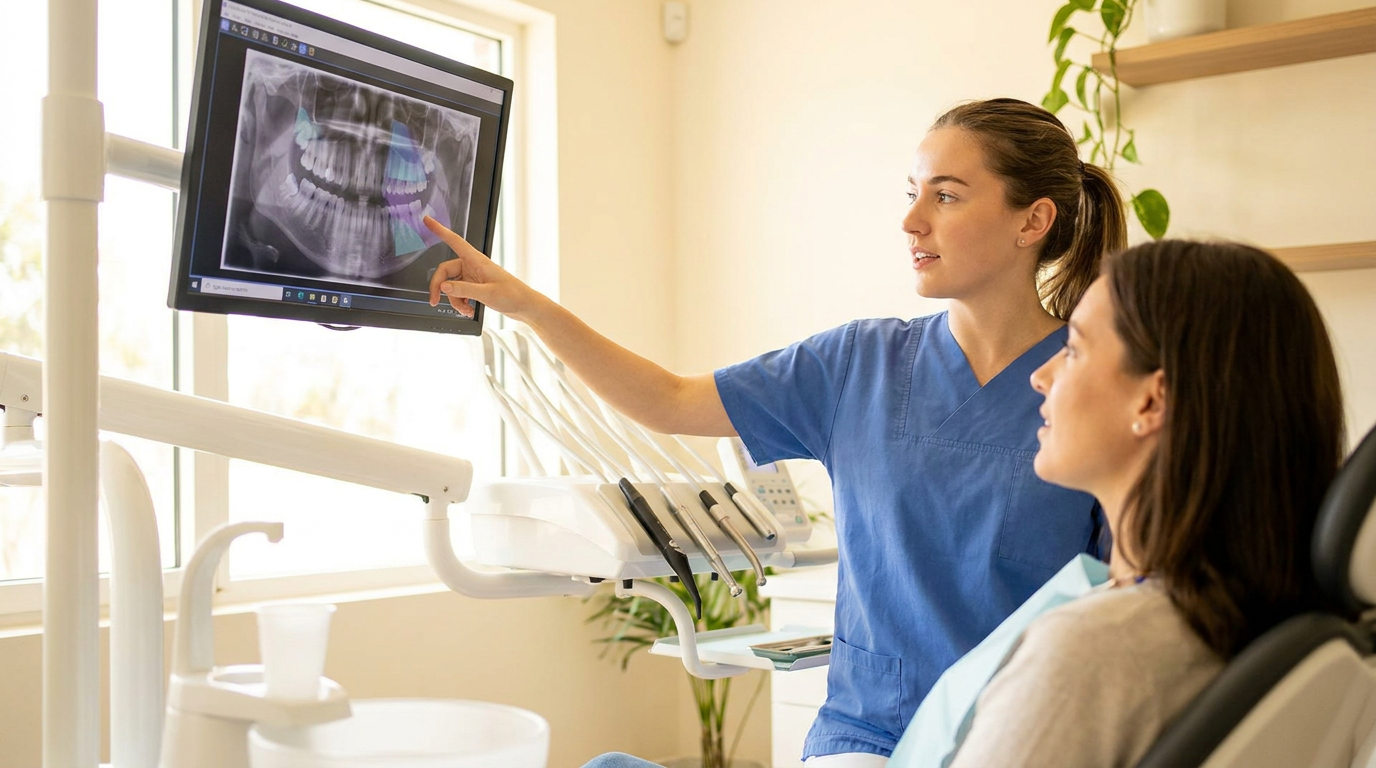
The clinical standard that makes the data meaningful
Analytics is only as useful as the clinical standard it's measuring. Data built on inconsistent diagnostic inputs measures inconsistency more than it measures performance. You need providers working from the same starting point before the analytics tell you anything reliable.
Overjet's Vision AI gives them one. It holds FDA clearance for both caries detection and bone level quantification, which means the diagnostic output is validated to a clinical standard every provider at every location works from. In documented deployments, 100% of dentists found more caries with AI assistance and 91% found more periodontal disease. That production was already sitting in the existing patient base, undetected and unbilled.
With a consistent diagnostic baseline across locations, DSO Analytics starts measuring what matters. Variation in case acceptance and hygiene capture becomes signal you can coach to, benchmark against, and set targets around with confidence that the underlying data is comparable.
The objection that comes up, and how to handle it
Most growth planning conversations surface some version of this: "We already have initiatives running. Adding something new risks distracting operations."
Worth taking seriously. Standard enterprise rollouts are big-bang implementations that require retraining staff, changing workflows, and absorbing months of disruption before producing any return. This pilot doesn't work that way.
It runs across three to five underperforming locations over 90 days. DSO Analytics tracks adoption, case acceptance, and production per practice from day one. The COO owns execution and has daily utilization data and location-level dashboards, including same-day visibility if adoption drops at a specific site. At the end of 90 days, you have production lift data from your own locations, or a clear read on what didn't hold. Either outcome is more useful than a theoretical growth plan.
DSOs running this structure typically see 15 to 25% increases in treatment acceptance across piloted locations. If those numbers hold in your pilot, scaling to 25 locations by Q3 is a sequencing decision backed by your own CFO-validated data.
What this looks like on the cap table
Acquisition-led growth stacks premiums, integration costs, and deal complexity on the cap table with every transaction. Same-store growth improves EBITDA from assets you already own, with a mechanism investors can model and underwrite without waiting on a deal to close.
A 15% production lift across 50 existing locations is a different multiple conversation than "we're planning to acquire 10 more offices." It tells the board that current assets are being fully monetized and that the management team can grow production without proportional headcount increases. Growth doesn't require capital to scale. For a DSO approaching a recapitalization or exit, that's the efficiency story that moves valuation multiples. It's also the kind of story that holds up in diligence, because the underlying data came from your own locations.
DSO Analytics is how you put your own numbers behind that story before the next board cycle, backed by FDA-cleared diagnostic technology and location-level data your CFO can validate.
Book a demo to see how DSOs are structuring the 90-day pilot and what production outcomes they're bringing to their boards.
FAQs
Does DSO Analytics require replacing our practice management system or existing imaging software?
No. DSO Analytics layers onto your existing clinical workflows without replacing your PMS or imaging platform. The analytics pull from what your providers are already doing, which means there's no system migration and no parallel operational track to manage. Implementation is handled by Overjet's team, and providers continue using the tools they already know.
What does the pilot structure actually look like, and who owns it internally?
The pilot runs across three to five locations over 90 days. The COO typically owns execution. DSO Analytics provides daily utilization tracking and location-level performance dashboards, so your team has visibility at the practice level from day one, including same-day alerts if adoption drops at a specific site. The output at the end of 90 days is production per practice data from your own locations, which your CFO can validate and your PE partners can stress-test before any full rollout commitment is made.
How do we use DSO Analytics data in board and PE conversations?
The core value is that same-store growth claims become internally validated rather than projected. When you can show production per practice lift across piloted locations, with adoption data and case acceptance rates attached, you're presenting a board-ready growth story backed by your own numbers. Overjet also holds FDA clearance for caries detection and bone level quantification, which positions the DSO as having deployed validated clinical technology. That changes how the investment reads in a due diligence conversation.