Two same-size practices in the same region, running on the same PMS, with comparable provider counts. One consistently outproduces the other per chair per day. The gap traces to scheduling template discipline, case acceptance follow-through, and chair utilization consistency. COOs who can identify and close that gap across a portfolio have a direct path to production growth without touching headcount or disrupting top performers.
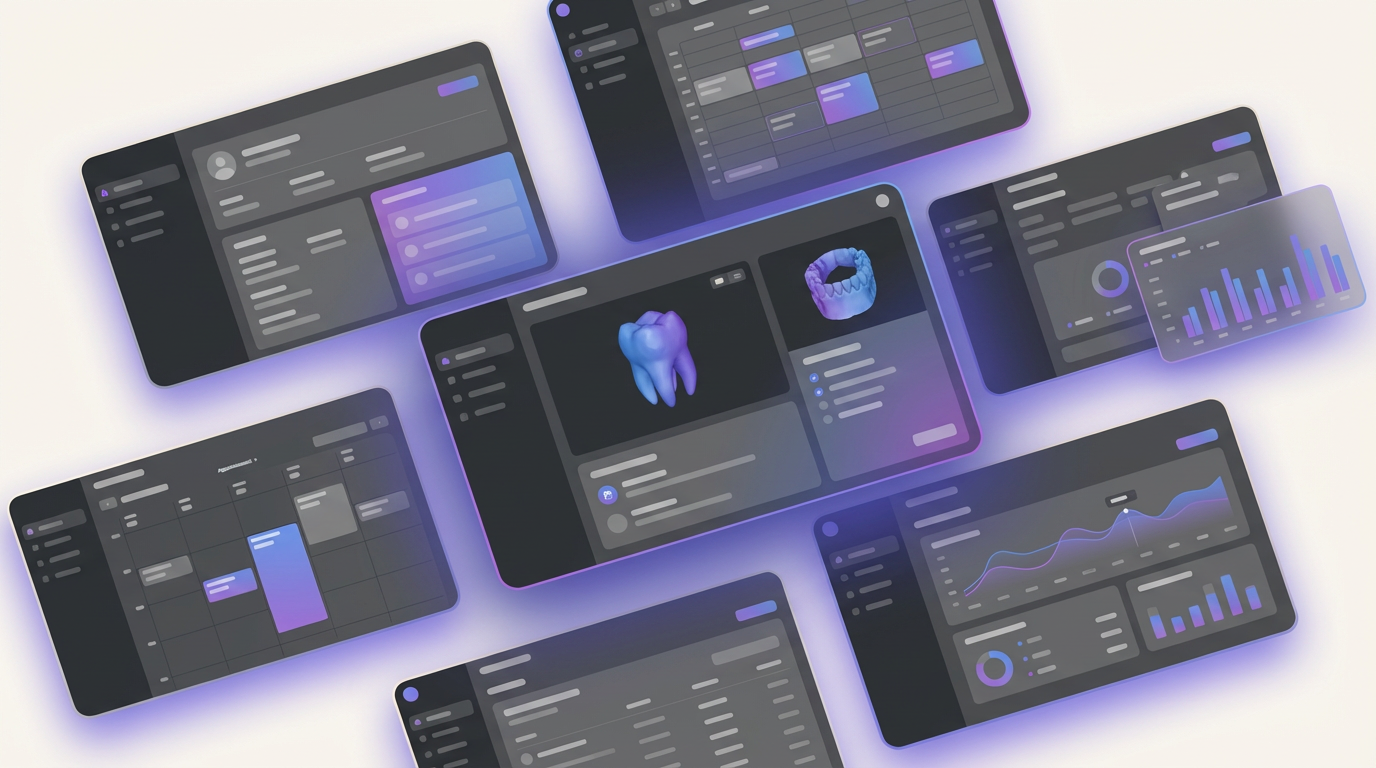
Overjet Analytics gives DSO operators the data to find that gap, measure it, and close it at scale.
Three Levers That Control Production Per Chair
Production variance across a DSO’s portfolio almost always traces back to three inputs.
Scheduling template adherence
When practices deviate from approved templates, chairs fill with lower-value procedures or run with gaps that don’t get backfilled. A practice targeting 85% chair utilization but running at 68% is leaving measurable production on the floor every day. Overjet Analytics flags that variance by site so ops teams know exactly where to focus.
Case acceptance rate
Treatment plans that don’t get presented, followed up, or closed represent production that’s already been diagnosed but never captured. Acceptance rates vary significantly across providers and locations. Surfacing that data at the practice and provider level turns a vague “we should do better on case acceptance” into a specific, coachable gap.
Per-chair utilization
Operatories running below target hours per day are the most direct measure of unused capacity. Tracking utilization by chair, by provider, and by location gives a COO a clear view of where capacity exists and where scheduling protocol changes will have the most impact.
None of these levers require new staff. They require consistent protocols and visibility into where each practice stands relative to network benchmarks.
Standardization That Providers Accept
Top producers push back when protocol changes feel arbitrary. Grounding standardization in each provider’s own data gives those conversations a factual foundation.
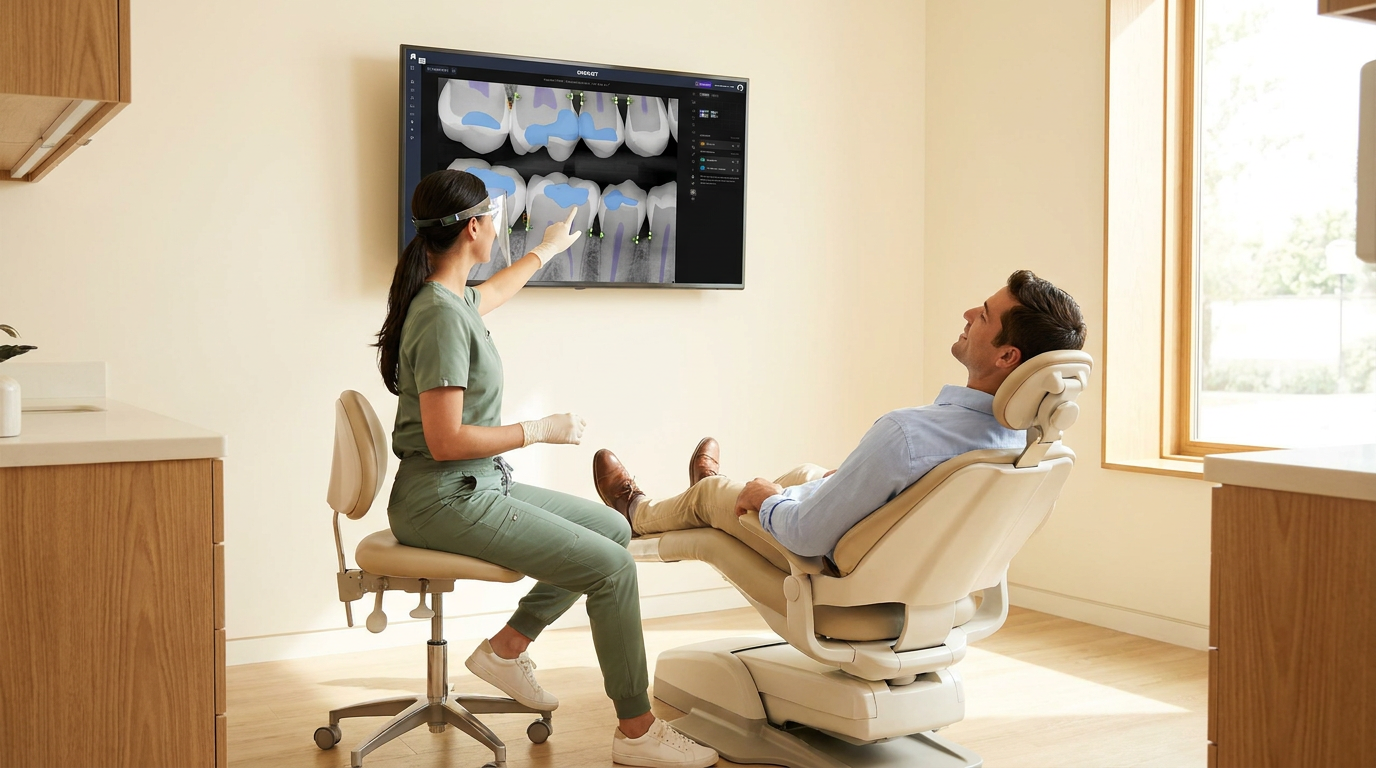
When a dentist sees their case acceptance rate sitting at 41% while the network average is 58%, the conversation changes. When a practice manager sees their chair utilization trend against the regional benchmark, schedule adjustments have a clear rationale.
Overjet Analytics surfaces production, utilization, and acceptance data at the practice and provider level, giving ops teams specific numbers to work from rather than a policy directive.
For rollout, a focused pilot works better than a simultaneous network-wide push. Start with two or three practices in one region, establish a baseline, measure the lift, and use that data to build the case for regional expansion. The pilot-to-portfolio cadence reduces risk and gives COOs a documented proof point before they scale.
From Pilot to Portfolio
Overjet Analytics connects directly to existing PMS data. Ops teams don’t rebuild processes or migrate to a new system. The platform pulls production, scheduling, and utilization data from where it already lives and surfaces it in a portfolio-level dashboard that gives a COO visibility across all sites in one view.
Practices establish a baseline across the three levers, scheduling adjustments and case acceptance protocols go into place at pilot sites, and COOs have enough data to assess lift, identify which changes drove it, and build a rollout plan for the broader network.
That production data also improves EBITDA forecasting. When per-chair utilization and case acceptance are tracked consistently across the portfolio, production projections get more reliable. Finance teams stop modeling on historical averages and start working with current operational data.
Frequently Asked Questions
How does Overjet Analytics help DSO COOs identify production gaps across multiple practices?
Overjet Analytics pulls data from your existing PMS and surfaces production, chair utilization, and case acceptance metrics at the practice, provider, and portfolio level. COOs can see where performance gaps exist across sites without pulling manual reports from each location.
What KPIs should DSO operators track to improve production per chair?
The three most direct indicators are chair utilization rate, case acceptance rate, and scheduling template adherence. Tracking these consistently across locations gives ops teams the data to prioritize where intervention will have the most impact.
How long does it take to see measurable production improvement after implementing standardized scheduling protocols?
The timeline depends on how quickly pilot practices implement scheduling and case acceptance changes and how consistently those protocols are applied. DSOs that establish a clear baseline at pilot sites before expanding regionally tend to move faster and with less disruption.
Can Overjet Analytics integrate with our existing practice management software?
Yes. Overjet Analytics connects to existing PMS systems. Implementation doesn't require practices to change their current workflows or migrate to a new platform.
Ready to see how this works across your portfolio? Book a Demo