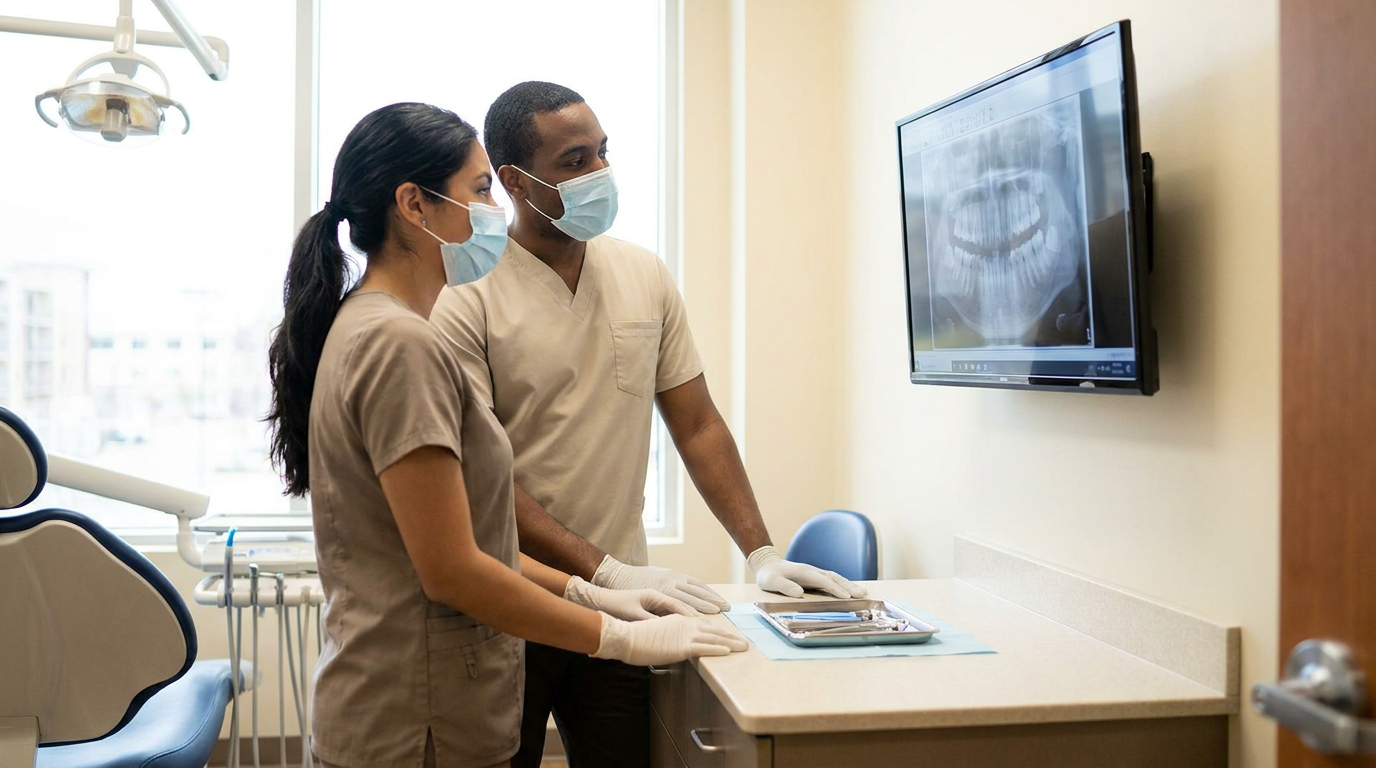








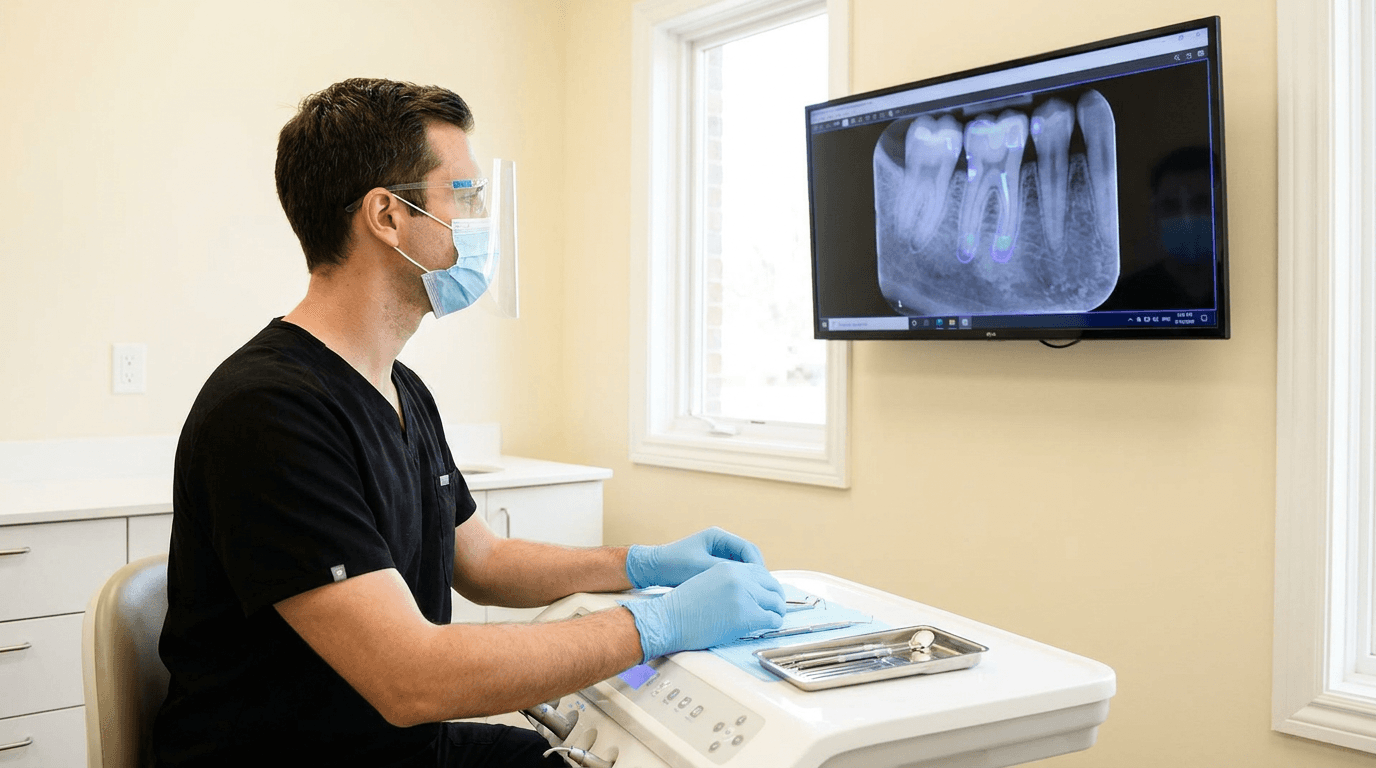
DSOs direct between 25-30% of operating resources to staffing. That's the largest single line item on the P&L, and for most CFOs, it's also the hardest to move. Vendor contracts get renegotiated. Supply spend gets centralized. But labor cost per visit tends to hold because the underlying problem isn't headcount. It's utilization — how much billable production each scheduled provider hour actually generates. Before adding dentists or opening new chairs, there's a more tractable question: is the capacity already on the schedule being used well?
Where provider time goes
The answer, at most DSOs, is no. But not for the reasons CFOs typically investigate.
Provider time leaks in two specific places. The first is incomplete treatment planning: conditions present on a radiograph that don't get identified, documented, or presented to the patient. The second is low case acceptance: conditions that get presented but don't convert to a scheduled appointment. Both problems look identical from a scheduling report. The provider was in the chair. The hour was billed. But the production that should have come from that visit didn't materialize.
Overjet's Dental AI suite measures detection and acceptance rates at the provider level across every site in a portfolio. That means a CFO can see not just aggregate production numbers but where, specifically, the gap between clinical capacity and actual output is widest.
What the math looks like at scale
Consider a 30-site DSO where each site has three providers averaging 32 scheduled hours per week. At a production rate of $280 per provider hour (conservative by current benchmarks as some sources cite $500-$800/hour) the portfolio runs roughly $125 million in annual production capacity.
If 12% of that capacity goes unrealized due to missed detection and low acceptance, the portfolio is leaving around $15 million on the table annually. That's not a revenue projection. It's production that was already scheduled, already staffed, and already paying the labor cost without generating the corresponding output.
Closing half that gap through improved detection and acceptance rates adds approximately $7.5 million in production without adding a single provider hour. Labor cost per visit drops. EBITDA improves. The denominator in every per-visit cost metric gets better because the staffing expense stays flat while output rises.
CFOs should run these numbers against their own assumptions. The inputs that matter are current production per provider hour, case acceptance rate by site, and average hours scheduled per week. Overjet Analytics surfaces all three across the full portfolio.
Why this is a different calculation than production lift
Most dental AI ROI conversations start with production lift: how much additional revenue the tool generates. That's a useful number, but it's a revenue-side calculation. Labor efficiency is a cost-side calculation, and for CFOs operating under reimbursement pressure, the cost side is where the more defensible case gets built.
A 4% improvement in labor cost per visit across 30 sites compounds differently than a 4% production increase. Production lift is sensitive to payer mix, chair availability, and provider capacity. Labor efficiency gains persist regardless of whether you're adding new patients or working through an existing panel. They show up in EBITDA margin even in a flat-revenue quarter.
The CFOs getting the most traction with AI investment internally aren't pitching it as a revenue tool. They're presenting it as a utilization tool — one that makes the labor spend already on the books produce more output per dollar. That framing holds up in a board presentation in a way that optimistic production forecasts often don't.
Book a demo of Overjet Analytics to see how provider utilization data maps to your specific portfolio.
Frequently Asked Questions
How does dental AI affect provider utilization rates in a DSO?
Dental AI-assisted workflows improve provider utilization by increasing the rate at which conditions get detected, documented, and presented to patients. When more of what's present on a radiograph gets identified and converted to scheduled treatment, providers generate more production per hour without any change to their schedule. Overjet Analytics tracks detection and acceptance rates by provider and site, giving DSO leadership a direct view of where utilization gaps are largest.
What is a realistic labor cost reduction per visit from deploying dental AI at scale?
The reduction depends on current utilization rates and case acceptance performance across the portfolio. A DSO closing half of a 12% utilization gap through improved detection and acceptance can generate meaningful additional production from existing scheduled hours, which lowers labor cost per visit without reducing headcount. CFOs should model this using their own production per provider hour and current acceptance rates rather than relying on vendor-supplied averages.
How do you measure provider efficiency across multiple DSO locations?
The most useful metrics are production per provider hour, case acceptance rate by provider and site, and the ratio of conditions detected to conditions scheduled. Aggregate production numbers obscure site-level variation — a portfolio average can look healthy while individual sites run significantly below capacity. Overjet Analytics surfaces these metrics at the site and provider level so CFOs and operations teams can identify underperforming locations and target interventions directly.
What's the difference between production lift and labor efficiency when evaluating dental AI ROI?
Production lift measures revenue upside: additional procedures completed because AI-assisted detection identified more treatable conditions. Labor efficiency measures cost-side improvement — more output generated per scheduled provider hour, which reduces labor cost per visit. Both matter, but they respond to different variables. Production lift is sensitive to payer mix and chair availability. Labor efficiency gains are more durable and show up in EBITDA margin regardless of revenue conditions.