


The Affinity Dental Playbook
At a glance
DSOs increase treatment planning rates by reviewing AI-detected findings daily, confirming them with the clinician, and building follow-up into the schedule. At Affinity Dental Management, operations teams check each day's findings before and after appointments, flag missing documentation, and export opportunities to share with providers, managers, and regionals, turning detected findings into documented, scheduled care.
Core topic: How a mid-size DSO operationalizes dental AI analytics so that clinical and operational teams act on the same data from two angles. The conversation covers three threads: a daily workflow checking findings the day before and after each appointment, a coaching model feeding providers one focus metric at a time, and the distinction that Overjet detects and measures findings while clinicians decide and document.Key Takeaways
- Focusing on one metric at a time moves the number. Dr. Tanious ran a crown-focused cohort meeting monthly. One provider climbed from 14% to above 40% crown treatment planning rate, toward the organization goal of 30%.
- The daily day-before, day-after review catches missed opportunities. Teams print a per-provider action tab, review prior day findings, and prepare for the day ahead by pulling missing charts and confirming findings for early pre-authorization.
- Shared data aligns the front and back of the house. When hygienist, doctor, and treatment coordinator all reference the same visual findings, patients hear a consistent message, improving case acceptance.
In this webinar
Q: How does the operations team use the analytics in day-to-day work?
Margie explained it is a daily practice, not a monthly report. Teams print a per-provider action list, catch missing documentation, and flag potential concerns for the clinician to confirm before the final exam.
Q: How do you get from a chart to an actual clinical action?
Dr. Tanious drills into the recommendation performance table, filters for findings not treatment planned, and uses image links to jump to the radiograph Overjet flagged. She exports the list to Excel and sends it to the manager, regional, and doctor.
Q: How do clinical and operational perspectives come together to drive change?
Both leaders stressed alignment from executive level down to doctors, supported by continuous training. Weekly and monthly sessions walk providers through their own missed findings.
Q: How does AI documentation help with insurance?
Because many payers use AI in their own review, the supporting documentation and imaging help the team secure better pre-authorization approvals.
Q: What advice would you give a DSO adopting AI analytics?
Keep the daily process consistent, give providers data in small focused pieces, and manage expectations from onboarding. Presentation mode showing disease progression over time helps hesitant patients commit to treatment.
Speakers
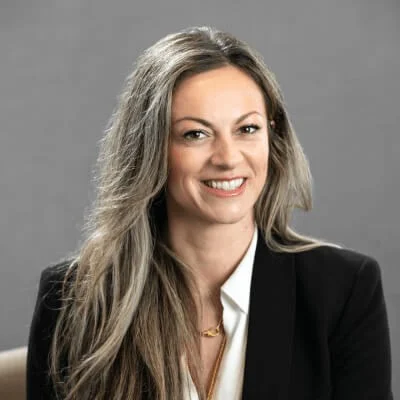
Dr. Mariz Tanious
Dentist
Dr. Mariz Tanious is the Chief Dental Officer of Affinity Dental Management, with more than 16 years of clinical and leadership experience. She leads quality-improvement and AI-integration programs across the group's clinical and operational workflows.
Affinity Dental Management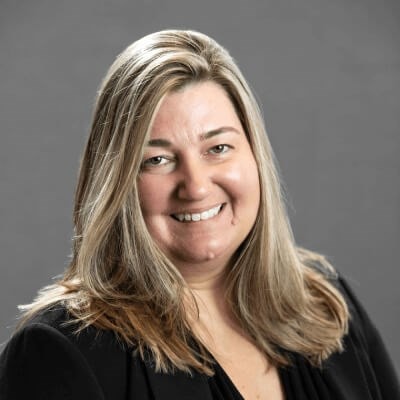
Marguerite "Margie" Dorsa
Operations leader
Marguerite "Margie" Dorsa is a Regional Manager at Affinity Dental Management. She oversees day-to-day operations across multiple offices and built the group's daily analytics-review routine.
Affinity Dental Management
Dr. Gordon Barfield
Host
Gordon Barfield is a dentist and Senior Clinical Manager at Overjet, and one of the company's full-time clinicians. He focuses on how dental AI supports diagnosis, case acceptance, and standardized care.
View ProfileFrequently Asked Questions
Q: How can a DSO raise treatment planning rates without overwhelming its dentists?
Give providers one focus metric at a time. Affinity grouped dentists into a cohort centered on crowns and reviewed findings monthly, resulting in steady incremental improvement.
Q: What is the difference between identifying a finding and treatment planning it?
A dentist may recognize a finding but record it only in a progress note. To move care forward it must be documented as a formal treatment plan.
Q: Does the AI diagnose the patient?
No. Overjet detects and measures findings on radiographs for review; clinicians make the diagnosis and decide on treatment. Admin staff can flag findings but do not diagnose.
Q: Why do false positives appear, and how should teams handle them?
Overjet reads shades of gray on images, so overlap or a non-carious lesion can produce a finding that is not decay. Teams treat the export as a worklist to verify with the clinician.
Q: How does showing images over time help case acceptance?
Presentation mode compares images across visits to show disease progression. Teams use it to help hesitant patients see decay advancing, supporting a more confident treatment decision.
Full transcript
Dr. Gordon Barfield: Good morning or afternoon depending on where you are. Uh welcome to our webinar today. Uh I'm Dr. Gordon Barfield. I'm a career dentist and orthodontist and a member of the clinical team here at Overjet, the world's leader in dental AI. We are very fortunate today to have uh two amazing leaders from Affinity Dental Management uh who I have known had the pleasure of knowing for a good while now. and they're going to share how both clinical leadership and operational teams can use Overjet's clinical intelligence platform and DSO analytics data to drive measurable business growth. We're joined first by Dr. Mariz Tannius who is the chief dental officer at Affinity as well as Margie Dorsa who's a regional manager at Affinity Dental Management. Welcome to both of you guys and uh again thank you so much for joining us uh and for you know donating your time for our audience to to learn about how you guys action upon this data that's being created by artificial intelligence. As I mentioned before, we've known each other for a while and we share a common passion for for the things that data uh can do to improve clinical outcomes and that's really what this is all about. I'm always impressed with how excited you both get when we're talking about datadriven insights. Um, and and I I I really love your passion. So, I'm excited for the audience to hear from you today on these topics.
Dr. Mariz Tannius: Thank you for having us.
Dr. Gordon Barfield: You bet. Um, Margie, I'll start out with you. You know, from from the operations perspective, how do you actually use Overjet's analytics tool in your weekly or monthly uh work with with the offices? What's the biggest operational impact that you see this tool and the data that flows from it having?
Margie Dorsa: Sure. It's actually the daily um day-to-day operational tasks that we've really been able to have the team focus on. Um and this really highlights that for them. So, it's no matter how busy the office is, they're able to really dive into each patient that's in front of them and utilize the information. So, for example, on here when we pull it up, we actually print out based on the providers every single day. So, they have like a little action tab any documentation that might be missing, any documentation that's necessary in order to properly diagnose the patient, for example, peroching, additional bite wings, any radioraphs. We're able to capture that before the doctor goes in to do their final assessment. It also alerts the team any potential concerns for the clinician to review carries detection, PLR, um, anything like that with bone changes. We're able to identify that and then have the team focus and present treatment plans for patient acceptance. It's also been crucial with having patients um, see and identify what the providers are talking about without just having an image of an X-ray. they're able to see in color what these providers are explaining to them so that it can help educate them for their treatment.
Dr. Gordon Barfield: For sure. I love that. Um, and we talk about spotting care opportunities. That's a common theme here, right? You know, one of the beauties about artificial intelligence is it does a really great job of spotting opportunities for care that we as, you know, frail human beings with with some weaknesses might well miss. We all miss things, right? Um can you share an example of how the analytics themselves help you identify an opportunity may maybe at one of your locations and then ultimately what prompted you to act upon it or how you acted upon that opportunity.
Margie Dorsa: Absolutely. Um so on this slide it shows potential for periodonal um conditions and periodonal charting that is required because it's identifying um discrepancies in the bone levels. So this helps us with our hygienists and our clinicians to go ahead and get that documentation and then once we have it they can reaffirm that yes the person either needs scaling and ro planing see the periodontist additional treatment and we can go ahead and either send out pre-authorizations or get those patients alerted and scheduled for that treatment.
Dr. Gordon Barfield: Beautiful. So, so having information right at hand that we have not had before this type of tooling allowing us in real time to um have this data to be able to take action upon it whereas before we may have intuitively known some of these things and some of them we may have not. Is that kind of the way it goes?
Margie Dorsa: 100%. And somebody can look at X-ray say oh you know they're good the inflammation but when you get the numbers and you're getting that that actually helps them to provide treatment. The other aspect is with the car's detection, we've noticed an uptick in our um provider in one of the locations where he has been able to identify those missed opportunities and providing the care that the patient needs just because you know it could have been oh let me watch that next time and this is saying you know this is really something that needs to be addressed and he can either get another radioraph see it from a different um angle or just confirm that you know what this is something we need to address now and not wait
Dr. Gordon Barfield: Yeah, got it. You you guys make such a wonderful team. I always enjoy working with the both of you so much because your your your alignment, your synergy around these concepts are are so wonderful and ultimately leading to better patient care because that's what this is about. Dr. T, um uh I I just want to ask the question, you know, you talk about how analytics helps you answer this core clinical leadership question. In other words, why is this happening? But I know the audience wants to know about kind of the the nuts and bolts of how this happens. How do we go from a simple chart or a data visualization to an action, a clinical action which leads to an increased treatment plan to hopefully increase case acceptance? What's the bottom line here?
Dr. Mariz Tannius: The the bottom line is really uh taking this the all this analytics that we get and turning it into actual data. And I know we talk about that all the time, but I do want to go back to the slide one slide before that I wanted to just add um you know when Margie's team is looking at the analytics uh from this page, you know, they are filtering and and you know I want to point this out because this is very important. They filter the day before and the day after. They look at the day before for missed opportunities at the end of the day um that you know the clinician might might have missed. Um and then they also look a day ahead to prepare for the following day where they can you know review with the provider. They take this information to the provider and they say, "Hey, can you take a look at these findings? Do you agree with these findings?" And if so, we could maybe start pre-authorizations ahead of time or hey, did you miss anything like overjet's mentioning something? Do you agree or disagree with these findings? So that really helps drive um you know the provider in this in this particular office to be successful and to uh make sure that our patients are receiving the best quality care. Now if we go to the next slide um which focuses on you know f furthering that um you know I'm I'm what I'd like to show you here on this slide is you know the last two years uh before you know not counting 2025 this provider already had a higher treatment planning rate than you know maybe other providers within our company and this is specifically for crowns and the reason why I'm focusing on crowns is because this year we focused on a cohort of uh putting our our doctors in groups and trying to bring up those uh treatment planning rates uh by focusing on one particular data point. Um Overjet is wonderful with providing so much information, but for doctors at the at the office level, that could be very overwhelming. So, I wanted them to get it in bite-sized forms. So, um, if we're looking just at crowns, we're looking at this provider and you know, again, in 2024, um, and I would say this is a higher treatment planning rate than I would have expected, but it's because his team was already on board with that prior, uh, process that we spoke about. Now, if we move in, and by the way, you know, you could with this dashboard, I mean, I'm looking at this dashboard every day. I'm filtering for providers. I'm filtering for different crown uh recommendations. I'm looking at, you know, appointment dates. I'm looking at prior dates. I'm looking ahead, a week ahead and looking at what opportunities are coming in or what have we been missing. And that way it helps me pinpoint um not just provider but office or region and say, okay, maybe this region needs additional help or maybe this office needs additional help. So from that aspect I'd like to move to the next slide and show you year to date um you know we've seen in this provider an additional 10% increase in his treatment planning for crowns and that's because we've focused more on the doctors uh this year. So if this you know if his team has already been on board and now the doctor's on board you see that you know 46% I mean that's pretty that's pretty great from where we were before and even you know when you look at uh trends you know we're we're very big on trends and looking at okay an average is an average but is the doctor improving over time and that's really what we care about because they could have had a high average and then they're falling down right they're falling off the cliff and we don't want them to fall off the cliff. We want them to continue to be successful. And you know what I've learned is that doctors are successful. They are identifying but they might not be treatment planning yet in a in an actual uh formal documentation of a treatment plan. So after having my conversations with all the providers, they tend to understand, oh, okay, I I can't just put it in a progress note. I have to actually, you know, again, be actionable about it. You have to document it in a treatment plan. And case acceptance is a whole different beast. Uh, which I I, you know, we're not going to talk about today because there's so many variables. But, you know, increasing your treatment planning rate takes a lot of doctor work, but also the team has to be involved to really truly be successful. Sorry, that was a long-winded answer.
Dr. Gordon Barfield: No, it's a wonderful answer and and you actually answered my next question which was about clinical behaviors or workflow changes that contribute to that change. Um that that that's amazing. Um can you share an example of where uh perhaps um the the drill down capabilities in the data platform help you to identify some of these um uh care opportunities that otherwise might have been missed. and and what that kind of means when you look at it from an organizational perspective.
Dr. Mariz Tannius: So, you know, before I get into that because I I did want to share one more slide. If you could go to the next slide, Abby, thank you. Um I just wanted to share this doctor's trend. Um you know, we started off back uh last year at 14% treatment planning rate crowns. Now, our goal for this year was 30%, because again, you give the doctors in bite-size uh you know, bite-sized pieces of information that they can not be overwhelmed with. And so, as you see, when we started this cohort with me meeting with this team uh with my team every every month, um you know, you saw you see an upward trend in this graph. Um and then it was stable for a little bit, right? this doctor was getting over 40%. That's wonderful. There's some dips obviously, you know, there's seasonal changes in dentistry. Um, and and unfortunately, not every patient, you know, comes in or whatever it is. But, um, as you can see, there's a huge dip in August, and that's because he actually, uh, had, um, you know, was on leave for a little bit, and we started to ramp him up once he came back. And as you can see in January he went uh sorry not January November 26% treatment planning rate uh was climbing and we are still obviously not done with the end of the year. Um so there's more room for growth there but you know he was at a pretty steady 40% rate. um which shows that he was you know proof of concept right like you spend time with your doctor you create the processes they they um end up you know improving their performance now if you go to the next slide um I want to talk about how we drill down to uh actionable data and what does that look like um one thing I I'd like to say is all the doctors in every office have access to the analytic platform. They can look at their own data on a daily basis. I I give them, you know, free will to do that. They can see other doctors in their clinics. They just can't see the entire company. But I think it's very important to be transparent about the numbers and where they're at. Um that helps, you know, either motivate them or maybe it doesn't motivate them, but I find ways to help them um understand it from a positive perspective that there is room for growth and hey, you're already doing it. you just have to document it. So if if we're drilling down to the actionable data, um we usually scroll down to the uh recommendation performance uh that um that table there. If you click on it, it'll go to the next slide and it'll show you where I truly value this dashboard. Um it helps us see all the patients coming in. Um after obviously we've uh we have filtered for what we want. Uh typically I filter for everything that's uh not treatment plan. So that's all the false findings. And then I look at all the the links to the right here. Um the links show us exactly which tooth or you know radioraph overjet is identifying. So when we click on that, it takes us to radiographs that Overjet has identified. So that to me is very important because the doctor isn't, you know, having to do so many different tasks. They're actually able to just click within Overjet to take them to that that data point, that radioraph that's telling them there's something there. Um, I also use this um to look at, you know, when are patients coming back, right? When are they coming back in a day or two? Are they coming back in six months? If we're looking at their next appointment date and this patient definitely needs to come in for that particular treatment, we're able to reappoint them and that then goes back to the operational team. So what I like to do so that everyone has the same snapshot that I'm looking at is I actually export this into an Excel document which is doable here um you know through this platform and when I when I have this particular Excel uh spreadsheet I send it to the manager to the regional and to the doctor and I say hey guys this is the opportunity that we have please double check you know again there there's going to be false positives and those false positives positives are generally um things that you know are caused from overlap or maybe it's a um you know an abraction lesion and again overjet only looks at you know what it's actually reading is different shades of gray and and when you understand that you're using it as a tool to help you. So taking that data, the doctors and the managers work together to help improve their uh overall performance and then at the end of the day patients are receiving the care that they deserve and need.
Dr. Gordon Barfield: Yeah, I love that. And and you know that goes right to sort of what I'm thinking about next is is clinical and operational alignment, right? You guys are looking at the same piece of data, right? But from two different lenses, from two different angles, if you will, how did those two perspectives kind of come together and merge to be able to drive change uh across the organization? Because at the end of the day, what we're trying to do is drive change, right? We just do it differently.
Dr. Mariz Tannius: Correct. We're driving change uh from a behavioral standpoint, right? But we need to have an action plan. So the action plan typically is you know in involving our you know executive team and everyone has to be aligned with that. Uh once once we are in alignment then we can drill down to you know the regionals to the office managers to the doctors at the clinical level. Um and when we do that you know you have to have training. So there's a lot of training involved. There's a lot of you know uh continuous training. It's not a oneanddone kind of thing. And I think that's what people don't understand is continuous training is very important. So you know every week uh I meet with some of the doctors every week and then for this cohort monthly you know I I show them this data and I say hey guys this is your these are your patients. Let's see what we missed and why did we miss it. You know tell me like walk me through. Was it that it was it looked like it was there, but it wasn't there? You know, I I like to um you know, the these are not my ideas. I didn't I didn't make up rules in dentistry. I follow the rules from different organizations like the uh the uh American College of Prostadontics, right? This is one this is one of the the the associations that I love to follow because they kind of set the standards for us. uh they have certain guidelines, they have position papers and when you look at their position paper on, you know, crowns or or fixed prostadontics, you look at, you know, they're there's no true acceptable measure you could say for an open margin, but we can say that, you know, they have a guideline that says, you know, six to 120 microns is acceptable. Well, what does that actually mean? Can you see a you know on the on the higher end 120 microns is actually like not visible to the eye or not really visible on radiographs. So if that is the acceptable range and it's not visible on a radioraph when I see something that's visible like on the next slide then I say that yeah we should be you know we should be treating that right or like this is not about open margins this is about decay here but um you know on maybe go to the next two slides maybe these slides should have been rearranged but one more slide um so so number 18 for example, you know, it's it's visibly there. It's a short margin. Um, it's it's not really an optimal uh a crown that I would have liked to see in someone's mouth. So, Over identified that, right? We they they said, "Look here." And I'm looking and I'm like, I could see with my naked eye already. But, you know, when Overjet tells you and it's this big blob of red, if you want to go to the next slide, um, that should alert you. you know that should say hey okay I need to look at this right and then you should talk to the patient about it and from there treatment plan it if the patient disagrees then that's fine you could bring it up at the next visit and the next visit after that but we have to we have to follow the standards which tells us you know this is not an acceptable crown if you could really see it and we know that you know open margins can cause decay underneath a crown why would subject our patients to that and not be actionable about it.
Dr. Gordon Barfield: Yeah, 100%. Um, and and Margie, I want to I'm curious from the operational side of things, a similar question. How do you interact with the teams to drive these uh initiatives forward? Obviously, Dr. T is spending more time with the professional staff um than than with the the core team. How about your interaction with the support teams and and how does that look?
Margie Dorsa: Sure. So the support teams, they're gaining that documentation that could be missed and anything that is identified, like we're checking it the day after to see if there's anything and bringing it to the clinicians for them to review and say, "Yes, I agree with this or no, I don't agree with these findings." And once we do that, if need be, we get in touch with the patients, get them in either for an additional radioraph to tell them, you know, we use a tool that helps the providers look at your mouth in a different way and we able to get um that information for their treatments and get them back in and get them scheduled. Like Dr. Tanya said, if they're booked six months in advance, we don't want this decay to get worse and then it's an issue, you know, six months later. So, we contact them immediately, get them in, or if it's something that's identified, we already addressed with the patient. We send out for pre-authorizations and get them back in as soon as possible. And it also helps um as far as on another side, when we're trying to get those pre-authorizations, if anything comes back, we're able to use this documentation because a lot of the insuranceances are using AI also, and it allows us to get better approvals.
Dr. Gordon Barfield: Is there a point at which this data and the information that's available helps us align the professional team with the support team? I'm always curious about that because you know in the most successful dental practices, the teams are the best aligned typically, right? Tell me about y'all's experience in in that.
Margie Dorsa: Absolutely. It it brings the teams together because, you know, you have the front of the house and you have the back of the house and usually it's like the admin and the clinical staff, but when we're all together doing a common good for the patients and making sure that their care is getting taken care of, they're all part of the same team. So, the admin people feel like they are part of that clinical staff even though they're not clinicians and they can't diagnose, they're able to help support the doctor and bring it to their attention if it happened to be missed.
Dr. Gordon Barfield: Yeah. And same question for you, Dr. T, from the other side of things. You know, I I've been around this long enough to know that there is occasionally this underlying friction between professional clinicians and their support staff. And how do we minimize that? How do we use data to actually do that? And and where are you guys finding that success part?
Dr. Mariz Tannius: I mean, we find it, you know, again, I I think I've I may have mentioned this, but you know, we when we come together as an office and we're using the same programs and everyone's on, you know, um understanding how those programs work, then that's that's really where we find the success. And our patients see that as well. you know, when when a a hygienist is using this um to prepare the patient for when the doctor comes in to say the same exact thing and then, you know, from there the patient's like, "Oh, well, the hygienist says it and the doctor is saying it and then the treatment coordinator comes in and and says, you know, the doctor says you need this crown." The patient then automatically will say yes. Most of the time, I don't want to say automatically, but like, you know, most of the time they'll say yes because they see the urgency from the entire staff. Um, you know, there are people out there that might say, "Oh, you don't really need this now. We can wait six months or we could do this, you know, in the new year when your insurance renews or whatever." I I don't I don't see that as beneficial, you know. I I see it as the entire group has to have an urgency for why we do what we do. And if they don't and they're not aligned and they're not using overjet and they're not, you know, um getting their pre-offs early and they're not then the it it kind of falls apart and that's where you see stagnant numbers. um you know there are offices where some some providers just don't want to use it and I know that's that's the case for a lot of um different companies right not just for for Overjet but any AI company and I think that it's about how you present it and how you um manage your doctor's expectations from when you onboard them and you know again I'll talk about this at the end with my key takeaways but really when you have the entire uh office on board, you just find that they grow and it's incremental, but it shows at the end of the year. So, you know, and there's proof in the concept that we have right here.
Dr. Gordon Barfield: Yeah, that's that's absolutely spot on. I think it's uh uh oftentimes human change management is our biggest challenge here. And now uh you know data points being able to help us in that process doesn't solve everything but certainly helps us uh through that. Um as as we kind of close out and to to to get those key takeaways from you Dr. And Margie, based upon your experience at Affinity, what kinds of pieces of advice would you give to other DSOs or orgs or even practices thinking about adopting AI and specifically the analytics that are produced by artificial intelligence uh to you know to help improve clinical quality and then ultimately business outcomes that come along with better clinical performance.
Dr. Mariz Tannius: Margie, I'll let you take that one first.
Margie Dorsa: Sure. Um, so I would say that the daily consistent processes help for the successes of the entire team. So if we're just doing this on a daily and we're consistent with the processes and we're identifying and bringing it to everybody's attention, it works. Um, I just want to piggyback to what Dr. Tanya said as far as presenting it to the patients with treatment plans. The addition to Overjet doing that presentation mode has been very critical in where patients are like, I'll just wait. I'll just wait. I'll just wait. Because now we're able to show them a sequence of the different teeth and say, "Okay, well, number three, we waited. Here's all your progression X-rays." And it actually shows it advancing. And it's helped to have patients kind of commit to treatment that they were hesitant on.
Dr. Gordon Barfield: Yeah, for the audience for the audience, what Margie's referring to is one of the modules within Overjet where um you're able to compare images throughout time. In other words, a T1, T2, T3 time comparison, and ultimately show disease change over time. Go ahead, Dr. T. Sorry, I didn't mean to step on you.
Dr. Mariz Tannius: No, no. I I was just going to say I mean, and that's also a great um tool. I mean that that's the presentation mode is wonderful for uh patients but also for doctors and showing um you know oh you disagree with this well let's see what happened six months later when you disagreed with it they see that disease progression and that you know um it gives them a little bit more faith in you know the AI right like that it is accurate um but it is a teaching tool as well you know when is it that you actually start creating uh you know incipient decay right I mean obviously it's incipient u but there are sometimes where incipient decay may have also broken through the enamel um and and you know is that when you treat it right I mean there's obviously certain guidelines for that as well but there it's it's surprising to understand different doctor's philosophies um everyone was taught differently and then over time when you're in practice your philosophy changes. And um so when when there's someone like me who brings it up and asks the questions to the doctors, it's not to make them feel bad or uh really it's it's more to challenge them and to make them better because all I care about is you know making them better and then at the end of the day our patients get better care. Uh so you know it's a it's a wonderful tool. I can't live without this. So,
Margie Dorsa: and it's great for the admin because we're not clinicians, but it's identifying it through the AI and all we're doing is showing them what had been on the screen. So, it helps with that conversation.
Dr. Gordon Barfield: This is amazing. Um, and just like always when I talk with you guys, um, I get a a key takeaway and I learn um, more than I thought that I would learn. Um, this has been amazing. I hope it has for the audience as well. I want to thank both of you guys for being with us and donating your time to this discussion. Um we want this to be meaningful for the clinicians for the profession out there. So thank you all very very much again uh for your time and I think we've got a quick poll. Uh if anyone in the audience uh needs more information about Overjet Dental AI itself, please feel free to click on the poll and we'll get uh we'll get to you contact you with um your inquiry. So again Margie and and Dr. T, thank you so much. Hope you all have a wonderful, wonderful day and the rest of the week and of course for the holidays.
Dr. Mariz Tannius: Thank you so much, Dr. Gordon. Take care.